Full text visualisation
At BarcampNortheast4 last weekend and at the Python Northwest meetup on Thursday I gave a presentation on the work I've been doing generating full text visualisations of PDF document libraries.
This was the third BarcampNortheast event I have attended. Each has been slightly different but they have all been a weekend well spent. This year felt a little smaller than previous years but that may have partly been because we were in a bigger space.
I have been attending the python Edinburgh meetups for a while. They have always been interesting and the Northwest meetup this Thursday was the first since I moved back to the Northwest. The format, alternating talks and coding sessions, is different to Edinburgh, regular pub meetups with irregular talks, coding sessions and miniconferences. It was an interesting crowd and the other talks, on Apache Thrift and teaching programming to GCSE students (15-16 year olds), gave a really good variety of subjects to discuss later.
The Talk
The full slidedeck is available in PDF format. The code is available on github.
Slide 2
For the past 5 years I've been studying exosomes as a source of biomarkers for disease. I will not go into more detail on this here as it is not directly relevant. The important point is that during this time I have collected roughly 3000 journal articles, the majority of which are saved as PDF files.
Most of these files were saved as interesting at the time but have not been visited again. At this point I have little idea what many of them contain. Many of these forgotten PDF files are likely to still be interesting but it is difficult to find these documents when I need/want them.
Slide 3
There are a couple of options available to explore this library of PDF documents. Searching is an obvious option. The facility already exists in most PDF document viewers and it is the approach I've relied on for the past few years. Searching does have some limitations, it requires that I have a fairly good idea of what the file I am looking for contains and a familiarity with the keywords which will identify the document. For documents I have completely forgotten about or where the author uses non-standard terminology, something academics seem to take considerable pleasure in doing, searching is unlikely to identify a document.
The alternative I have been investigating is full text visualisation. There are a variety of different ways to approach this. I have decided to follow in the footsteps of Jonathan Stray and generate graphs based on similarity between documents.
Slide 4
Slide 5
Perhaps the most frustrating aspect of this project has been working with PDF documents. The format is intended to allow consistent layout and formatting of documents, not to facilitate automated extraction of information. It is difficult to extract text in the correct order, to extract titles and section headings.
pdfminer seems to be the best python based tool for extracting content from PDF files. It is a little rough around the edges though
Slide 6
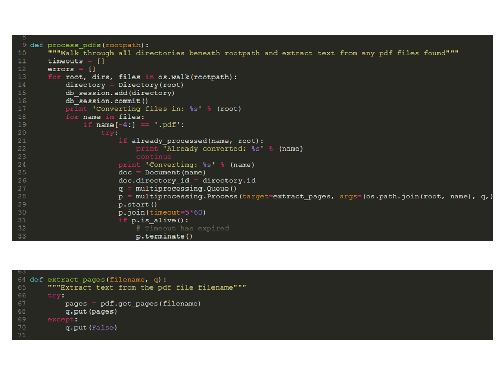
To overcome the problems with pdfminer I've run it in a subprocess. If pdfminer crashes only the subprocess is lost. If pdfminer hangs the subprocess can be terminated and the main script continue to the next document. It would be possible to re-write this to use a pool of subprocesses and make use of multiple cores.
Slide 7
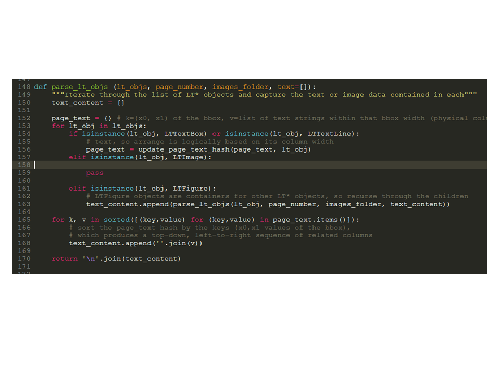
This is the guts of the text extraction process. pdfminer represents the PDF document as a series of nested objects. This function drills down the chain of objects until a text box is reached and extracts the text.
Slide 8
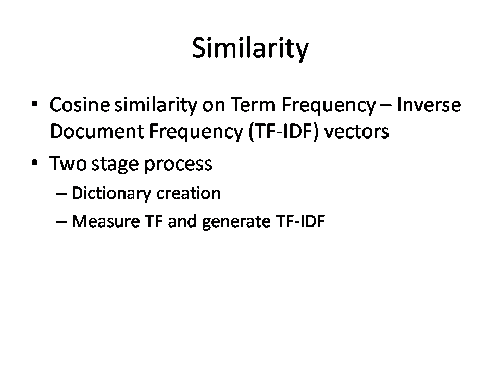
With all the text extracted and stored in a database it is necessary to calculate the similarity between the documents. I decided to use cosine similarity on Term Frequency - Inverse Document Frequency (TF-IDF) vectors.
This was a two step process. Firstly a dictionary is created of all the words in the library together with their IDF values. Secondly the term frequency for each word in each of the documents is calculated.
Slide 9
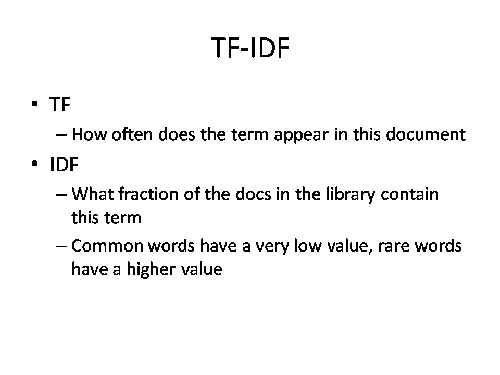
The Term Frequency (TF) is the number of times a term/word appears in a document
The Inverse Document Frequency is the inverse fraction of the documents a term appears in.
Slide 10
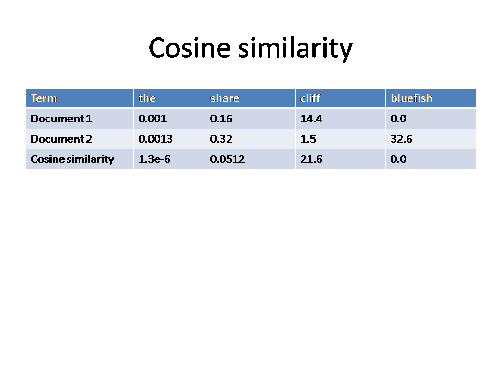
Cosine similarity sounded a lot more complex when I first heard the term than it actually is. Comparing two documents we have a list of values representing the TF-IDFs for specific words in those documents. If both documents contain a word the TF-IDF values are multiplied and added to a running total which represents the similarity of the two documents.
Slide 11
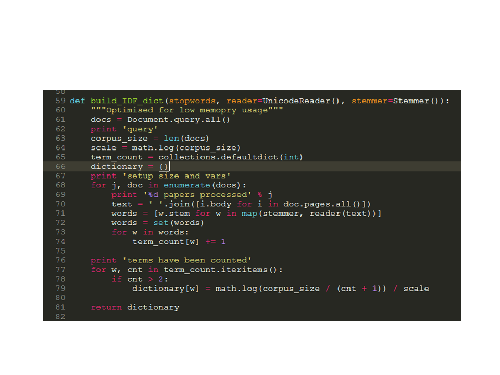
I've been using the tagger package (back-ported to python 2.6) to generate the TF-IDF values. It is intended to generate tags for documents rather than calculate similarity between documents but the underlying approach is similar. One issue I ran into with the tagger package was very high memory usage when generating the dictionary. The approach taken is to load all the documents into memory and work from there. This works fine for small libraries but not for the very large libraries I was working with. This is the rewritten function I have created for generating the IDF dictionary values.
Slide 12
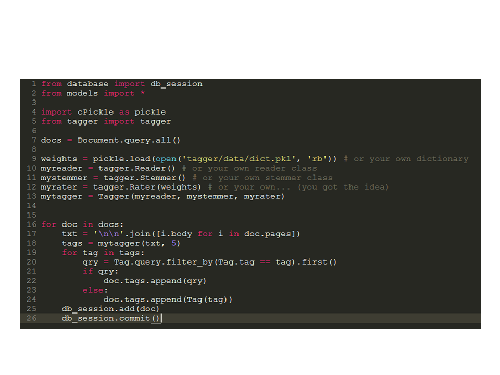
This is the expected usage of the tagger package. A tagger object is created from reader, stemmer and rater objects and then when supplied with a text to be analysed will return a specified number of tags.
Slide 13
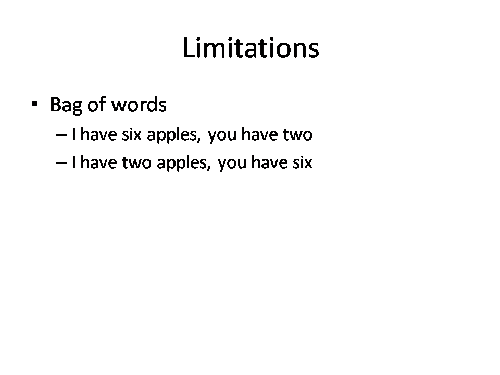
One limitation of the approach I've used is that no consideration is given to word order. Documents with very different meanings can be grouped together because they contain the same words.
Slide 14
I've not got as far as auto-generating the graphs. For the moment I've been using gephi.